Insights
Win rate, pipeline and why bids were won or lost, plus the patterns your record has taught you.
Insights shows how the business bids and wins. It has four views: Overview, Reports, Team and usage and What we've learned.
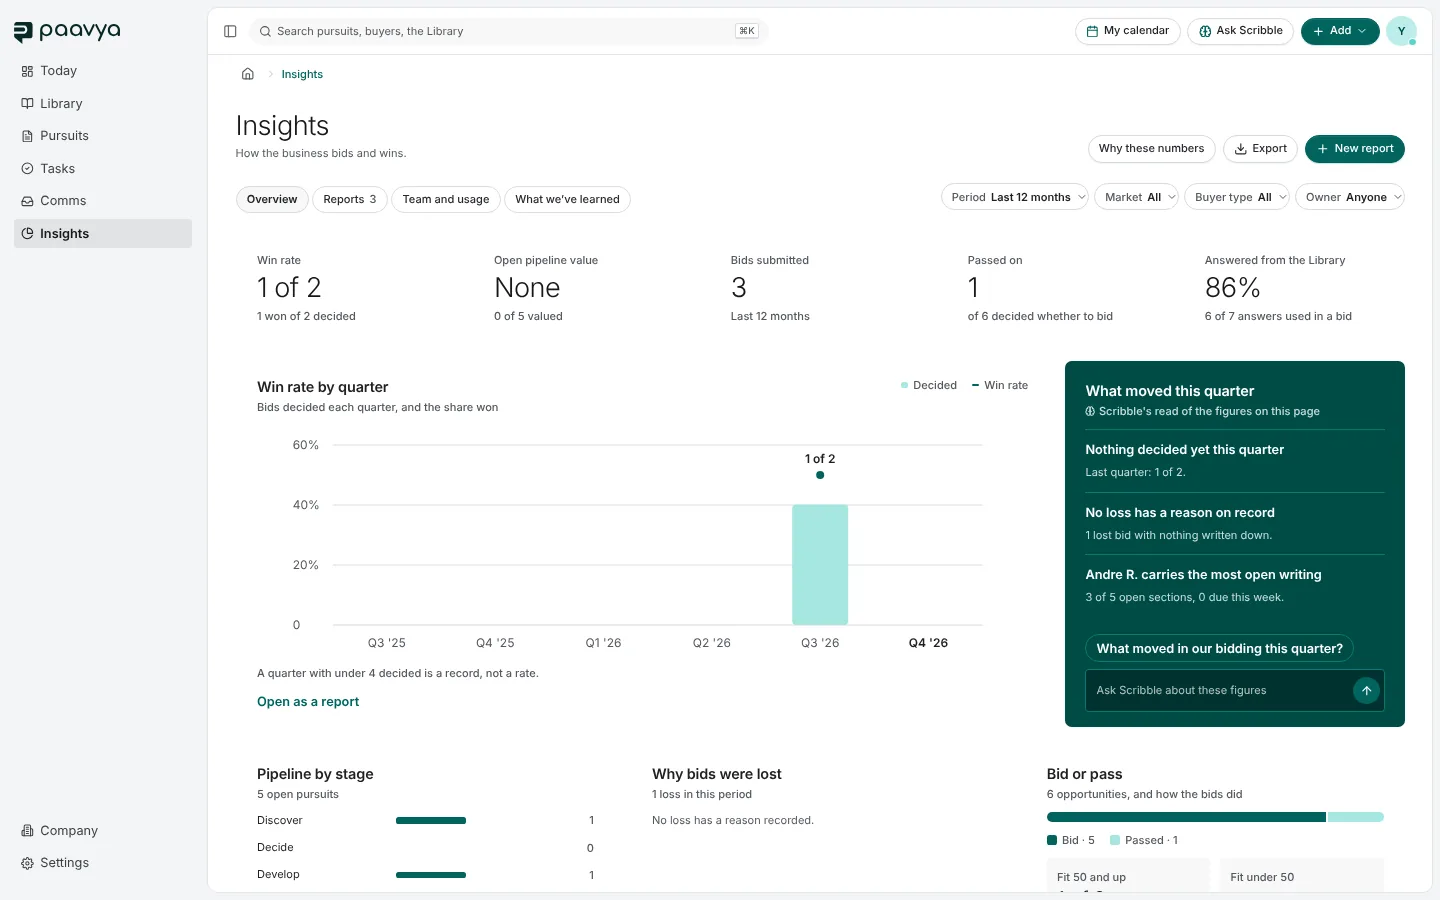
Overview
- The figures: win rate, open pipeline value, bids submitted, bids passed on and how much was answered from the Library.
- Win rate by quarter, with how many bids were decided each quarter. A quarter with too few decisions shows a count ("1 of 2") instead of a rate that would mislead.
- What moved this quarter: Scribble's read of the figures on the page, with a box to ask it more.
- Pipeline by stage, Why bids were lost and Bid or pass.
Filter by period, market, buyer type and owner. Why these numbers opens the reasoning, Export downloads a CSV, and New report saves a view under Reports.
What we've learned
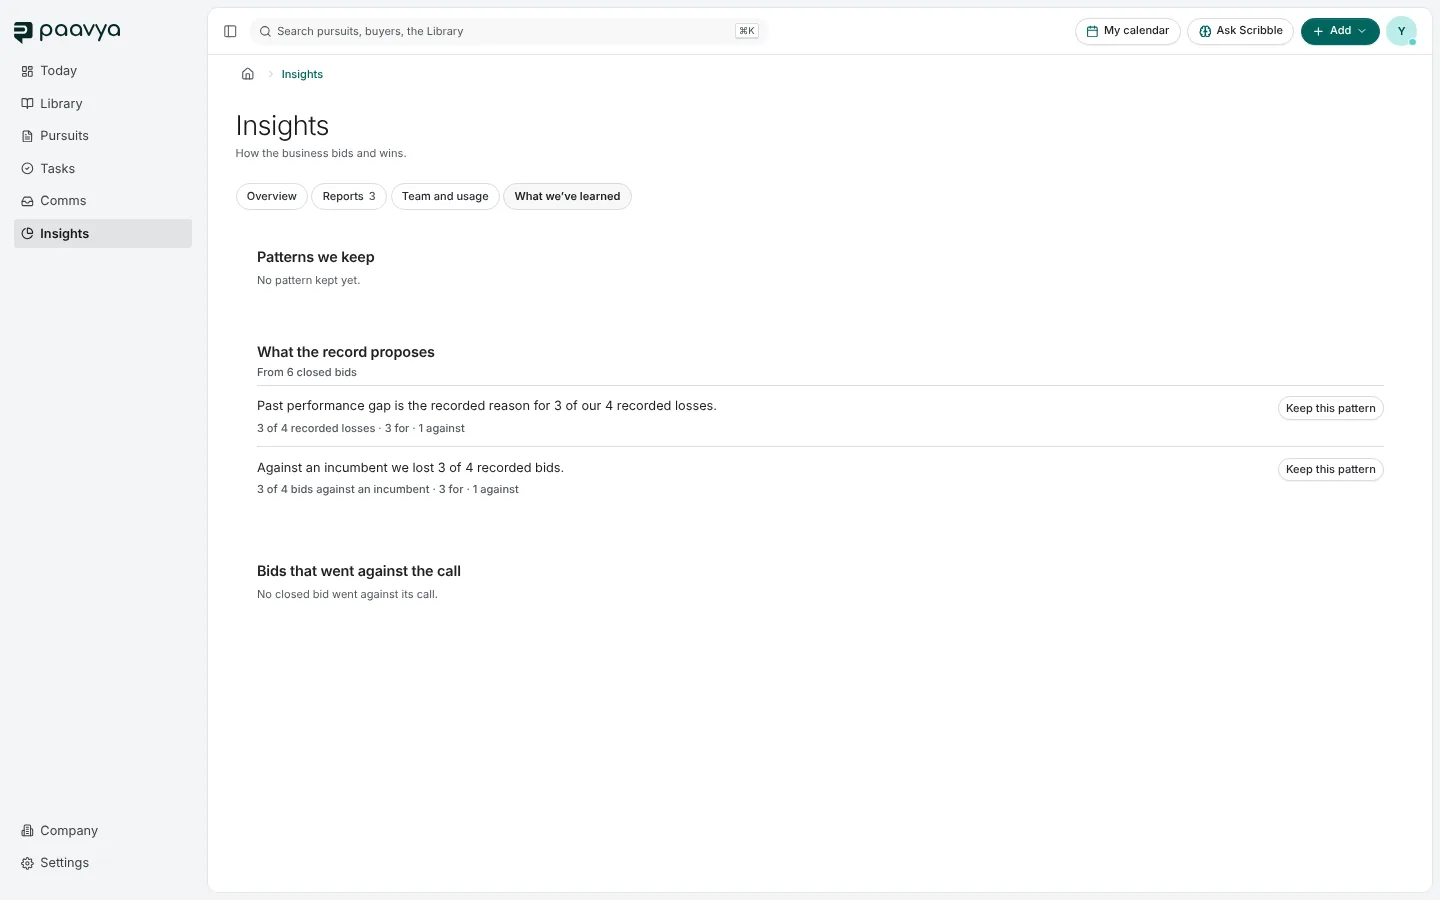
- Patterns we keep: what your team has decided is true about how you win and lose, each with its evidence and counts. Add evidence, or retract a pattern with a reason.
- What the record proposes: patterns Paavya noticed across closed bids, stated in counts ("3 of 4 recorded losses"). Keep this pattern adds one.
- Bids that went against the call: bids decided against the recommendation, or recommended bids that lost, each opening its Outcome.
This view is for the people who manage bids: pursuit managers, administrators and executives. Anyone else is told who it is for.
Pictures are from Paavya's demo workspace, so names, bids and figures are illustrative. Something here does not match what you see? Tell us, or ask Scribble in the app.